
Purpose
The purpose of this engagement is to model out a probabilistic scenario of the future of Plutus’ new dual-token economy with PLU and PLUS in order to calculate the feasibility of CRY rewards being sustainable through FUEL.
This model is meant to provide a baseline understanding of potential outcomes based on the given inputs, ceteris paribus; if reality deviates from the data and assumptions in the model, then the model, obviously, becomes irrelevant.
Disclaimer: this model takes the current growth rate of users (denominated in buy pressure value and cashback reward quantity), and this growth rate is not impacted by the token price as any assumptions about how exactly that would work would be completely theoretical. As such, the projected asset price follows a parabolic trajectory over the 5-year period. Please note that in reality growth rates are subject to change due to market conditions, token price, and an infinite array of other factors. This model is intended for educational purposes only and does not guarantee future performance.
Methodology
We use Machinations to build the future value flow within and around the Plutus economy. This is done using averages of historic and current data, as well as certain assumptions about the future (detailed in the Assumptions section). This data and assumptions are provided and/or confirmed by the Plutus team.
Once the economy is built, we run Monte Carlo simulations to calculate key metrics like PLU and PLUS prices, quantity of FUEL, etc. over different time frames. The gathered data is exported into Excel, where we can calculate the means and averages.
We input this cleaned data into a CRY rewards calculator, which allows us to calculate the final step: whether FUEL can sufficiently cover CRY rewards.
The amount of CRY is now rewarded as a percentage in tokens - i.e. if a user has 100 PLU staked, and he’s owed 6% yield for the year, he will earn 6 PLUS tokens.
Limitations
There are a few limitations to the model, and as such we urge the Plutus team and any reader to take the findings with a grain of salt. We did not have perfect data, nor can we see the future, so this model is meant to be used purely as a baseline to understand what would likely happen if the input data and assumptions were to be within reasonable accuracy months into the future.
The inputs of the model are based on varying historic data and averages. Whilst we had data from 3 years ago, it wasn’t always feasible to use it fully due to the implications. For example, looking at how much PLU was sold over 2.5 years, we calculated an average per month of ~1.2M PLU, however, over the last 4 months the average has significantly decreased to around ~400k PLU. Simultaneously, the quantity of PLU in wallets has also decreased significantly. If we were to use data from 3 years ago, the model will simply not be functionally useful as most wallets will be depleted within a few steps. Thus, we used historic averages over the last year for data that isn’t directly tied to PLU quantities, and we used the last available 4 months averages for data that governed selling and buying. All used data was provided and confirmed by Plutus.
There had to be assumptions made on future behaviour, such as the rate at which PLU Stackers will redeem their PLUS on PlutusSwap or for different utilities, or growth rates. There were also assumptions made for PLUS buying and selling. Where possible, we used historic data to make assumptions about the future user behaviour; where impossible, such as future rates of redemptions, Plutus provided data based on their knowledge of their users.
Each user category and tier has a plethora of users, each behaving independently from one another, however, in our model they are represented by 1 pool per stacking tier: there are Unstacked CEX and DEX users, as well as PLU Stackers within their 13 tiers. PLUS is represented as separate pools given its a different resource within the model. This means the averages are not only applied to data, but also to users, whereby we are generalising that each pool on average will behave in a certain way, pro rata.
CRY factors, such as moving PLU or redeeming PLU leading to a loss of CRY rewards / multipliers, are impossible to account for in Machinations or Excel given that we cannot model out each of the millions of users. So, average holdings per stacking tier are calculated based on buy and sell pressure metrics, and the CRY rewards are given to each tier unbiasedly based on the total stack.
The CRY rewards are calculated on a yearly basis in the CRY calculator, using end of year PLU stacking quantities in each tier. As such, when we mint extra PLUS tokens in the model to account for the deficit in FUEL until CRY becomes sustained, the quantity due to be minted gets summed in the CRY calculator and added to the model to be reran again, for all the years until CRY becomes sustained with FUEL. Whilst the APYs are paid out on a monthly basis, this is not an agent based model that differentiates between different durations of stacking nor the months that users join, hence we take those PLUS tokens and add them over 12 months to the model. In an agent based simulation this may play a marginal role in impacting quantity of CRY owed or PLUS minted, but it will not be significant enough to change results in any meaningful way.
The model is built on Machinations which requires an AMM to connect buy and sell pressure against price. This AMM has two key limitations:
It does not operate like order book market makers would on CEXs by filling bids and asks, nor is it designed to operate like Uniswap V3 and beyond. It is a pure constant product market maker (CPMM) with inefficient liquidity allocation and no ability to adapt to market conditions.
It is biphasic - it requires all sells and buys for a given period (in this case 1 month) to come in on 2 intermittent steps. i.e. first sells from month 1, then buys from month 1, then sells from month 2, then buys from month 2, etc. This means the impact on price can become relatively greater than we can mitigate by calculating the average of two steps over the course of decades. It also requires the data to be exported to Excel and uses means as final results.
The model doesn’t account for market dynamics like bull and bear markets, meaning that the margin of error beyond the average crypto bull-bear cycle of 1-2 years grows significantly.
The model is on a monthly basis, meaning it aggregates daily trades into months.
The model grows parabolic with time - a natural result of the assumptions of buy pressure. Even with decaying growth, it is still assumed that there is a set number of sells, and a set number of buys, and the model is left to run its course. Assuming that the price doesn’t go parabolic is in essence the same as stating precisely when something will happen years down the line, which is a worse assumption than the reality of parabolic endings.
The 5% FUEL tax is applied onto full quantities of PLUS movements (like MMs selling), instead of the ones that will happen only on a DEX. Most transactions happen on DEXs, so the inaccuracy isn’t noticeably great, and this allows us to account for P2P transactions for PLUS the data for which we simply do not have due to it not existing yet, thus overall to our best estimations this is fine, albeit arguably not scientifically accurate.
Note: the model is in $ due to USDT liquidity.
Assumptions
We made the following assumptions.
All PLU and PLUS are purchased and sold pro rata based on PLU holdings in each stacking tier.
Originally, PLU held by Unstacked users on DEXs is 4,064,304, and on CEXs is 451,693. In total however, those PLU pools have on DEXs 6,700,592, and on CEXs 755,940, because we added ~2.7M the tokens of “Inactive Users” to these pools (pro rata), because it is unclear what their buying and selling behaviour would be so the best assumption is that they’ll behave like Unstacked users.
PLU sold per month by Unstacked users is 257,754, which is 5.7% of the original current Unstacked holdings, so we will take that 5.7% to be sold each month from the pools.
PLU purchased per month is 3% of all purchased PLU (full number below in Stacked Users section). This is different to current data because Plutus team assume that Unstacked users will all transition to stacking over time. 3% is the highest percentage where over time the Unstacked wallets diminish their holdings and plateau at a new low equilibrium of a total of ~135k tokens split between DEX and CEX wallets. Anything more than 3% (in whole digits) leads eventually to growth again.
PLU held by Stacked users is currently 5,724,779, split amongst the tiers in the following way:
Category
Value
Sub only
783,822
Noob
201,388
Researcher
145,471
Explorer
319,508
Adventurer
466,560
Chad
914,384
Hero
688,404
Veteran
1,631,245
Legend
246,834
Myth
141,472
Goat
72,360
Honeybadger
63,331
Titan
50,000
PLU sold per month by Stackers is 1% of their holding per month, with every 3 months there being a spike of an additional 2%, totalling 3% being sold that one month; done to mimic dynamic user trading activity.
PLU purchased per month by Stackers is 97% of all purchased PLU, as per the note above regarding Unstacked Users.
Buy pressure value starts at $1M and grows at 1.35% per month, with every 3 months there being a spike of an additional 2% worth of buying totalling a growth rate of 3.35% for that one month; done to mimic dynamic user trading activity.
Over the last 4 months of available data, there was average buy pressure of ~$1.2M per month. However, given the existence of PLUS, this buy pressure is is now split between PLU and PLUS, since the original user has the same amount of money, but the buy pressure will be split between two currencies. The Plutus teams assumes splitting the buy pressure as $1M for PLU and $200k for PLUS is best.The growth rate of 1.35% is calculated by looking at the last 12 months worth of token holding amounts across all stacking tiers, and averaging them all out to one rate of change, which gave us 1.35%+.
Liquidity on exchanges is 405,360 PLU against $328,341 USDC/T/whatever, giving us a PLU price of $0.80.
Plutus will sell 4M worth of PLU tokens from its treasury via Market Makers, at a rate of 200k PLU per year (16,667 PLU per month).
PLUS held by users starts at 0.
Liquidity on exchanges is set to match PLU at 405,360 PLUS against $328,341 USDC, to allow the model to function.
PLUS buy pressure starts at $200k and grows at 1.35% per month, with every 3 months there being a spike of an additional 2% worth of selling totalling a growth rate of 3.35% for that one month; done to mimic dynamic user trading activity.
PLUS spending per month is 50% of current holdings per stacking tier. This PLUS is spent as follows (as per Plutus assumptions):
39% is spent on utilities.
48.75% is spent on selling PLUS on PlutusSwap.
12.25% gets withdrawn onto exchanges. There is a 30% fee in fiat taken from users at a value of £10 per PLUS - i.e. if a user sells 100 PLUS, they will pay £30 to Plutus.
Redeemed PLU is sold to B2B RaaS partners and T1 MM LPs:
Plutus sells 66% of PLUS to B2B RaaS partners who give PLUS as rewards to their communities. Due to regulations, this PLUS cannot be transferred to users but only redeemed by the users*, so 95% of it goes towards a redemptions pool, whilst 5% goes towards FUEL.
*the amount of PLUS actually redeemed by users is set to 50%.Plutus sells 34% of PLU to T1 MM LPs, who sell an average of 10.55% of PLUS per month as per Plutus’ assumptions, with 5% being spent on FUEL.
Extra PLUS is minted to ensure there are enough PLUS tokens given to people for Card + Perk emissions (cashback rewards), and as CRY rewards.
Average growth rate of emissions has been set to 1% as per the Plutus team recommendation.
The starting amount of PLUS to be emitted will be 41,960, as this was the last amount of PLU that was emitted for this purpose.
Extra PLUS is minted to ensure there are enough PLUS tokens given to people for Card + Perk emissions (cashback rewards), and as CRY rewards.
Results
PLU and PLU's Price
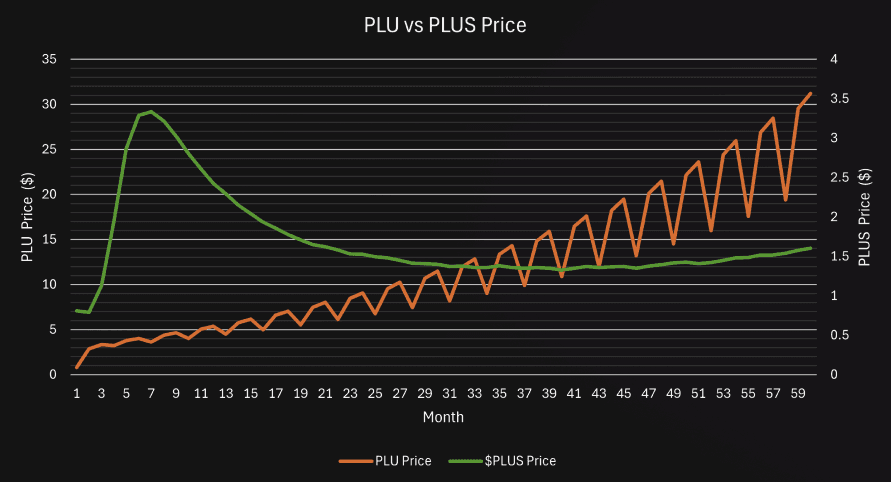
We see the PLU price steadily grow with the buy and sell shocks happening every 3 months (at different months) creating this staircase pattern. After 5 years, assuming current inputs remain accurate within a reasonable degree, the price of PLU grows towards $30.
PLUS on the other hand peaks at $3.40, drops down to ~$1.25, and then proceeds to grow again. Given that the quantity of minted PLUS plateaus whilst the quantity of PLUS purchased keeps rising, it makes sense that PLUS price keeps growing despite increasing supply.
Out of interest, we were asked with modelling PLU price over the course of 15 years. Below are the results.
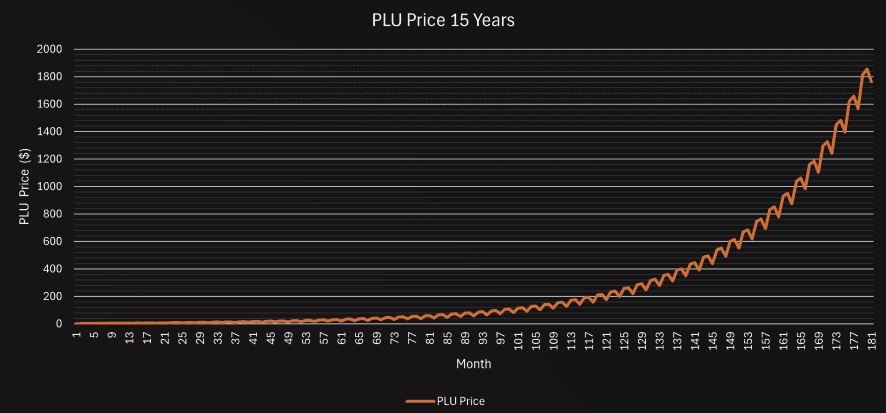
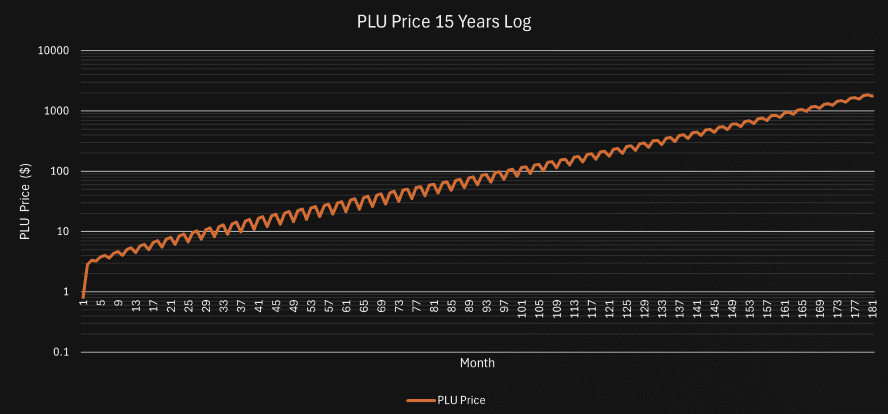
The price of PLU grows at an exponential rate into the thousands of dollars, which is better visualised on the logarithmic scale.
Buy Pressure
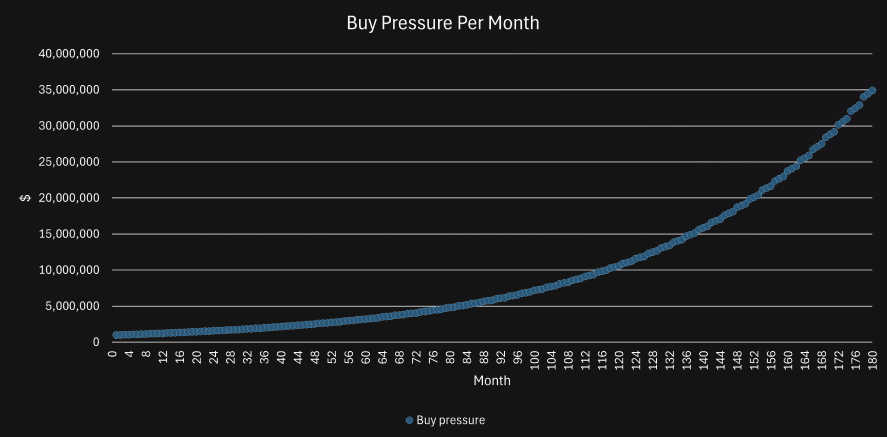
This is the result of the Buy Pressure growing year on year. By year 15, we see in the model it reaches $35M per month (obviously improbable but this is the result of growing rate of buy pressure MoM). If we take Plutus’ current number of users - 168,667 - to account for $1.2M in buy pressure, this means to reach $35M Plutus needs 4,919,454 users, ceteris paribus.
Once again, this is modelled purely for interest.
Fuel
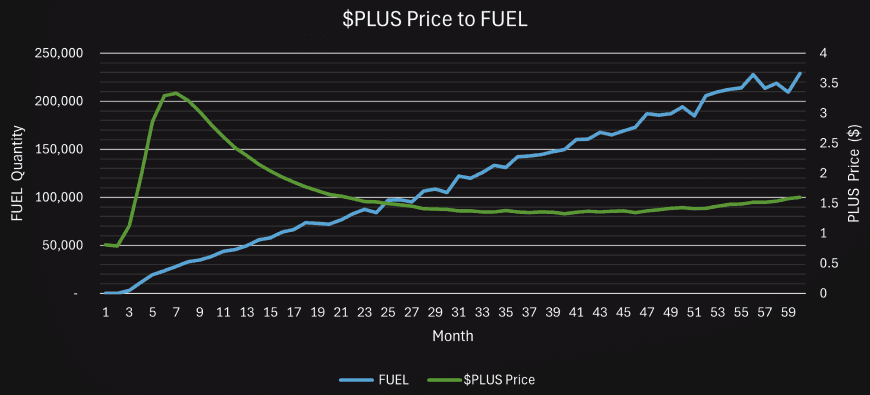
FUEL grows over time at a steady rate. Since the CRY rewards are distributed between stackers as a quantity of PLUS tokens based on the quantity of PLU tokens held, this means that if we run the model for long enough we will have enough FUEL eventually to cover all CRY rewards since the CRY rewards are super high only for the first 5 years during the multiplier.
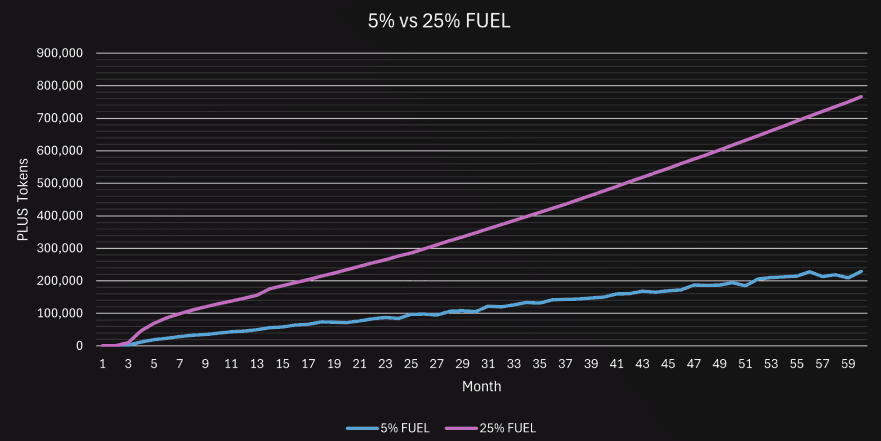
We have played around with the model to see whether increasing the FUEL tax from 5% will increase the quantity of PLUS tokens collected as FUEL to a relatively significant amount, and found that even 5x more FUEL tax (25%) doesn’t increase the quantity of FUEL collected in the first few years by a significant amount. Moreover, this will severely damage the user experience. Hence, we strongly advise avoiding it.
We have inputted the 5% FUEL data into a CRY calculator (attached separately).
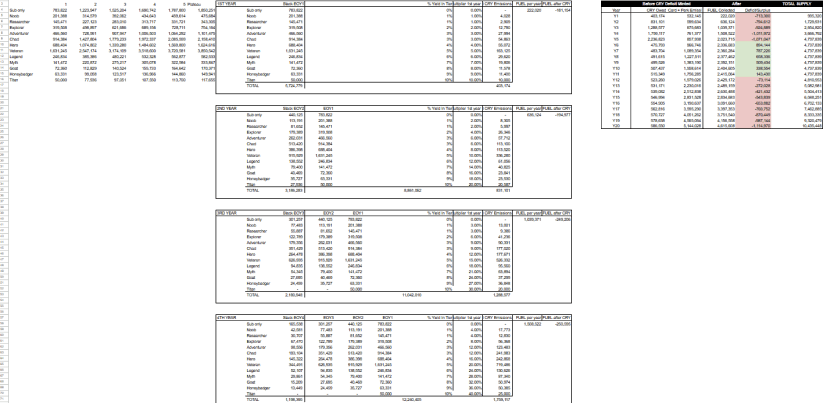
We showcase the quantity of PLU stacked, and the corresponding CRY rewards with the bonus yield over 5 years and beyond. Looking at the quantity of CRY required YoY, we see that after 5 years it significantly drops to an approximate maximum of ~475k because the multipliers finish. After this, the CRY owed slowly grows towards a maximum of ~586k which is the highest amount of rewards assuming the most amount of PLU stacked in stacking tiers at the same distribution as they are now. This happens after 20 years, when the 4M PLU from the Plutus treasury are finished being sold.
The maximum quantity of PLU tokens stacked in the stacking tiers is approximately 16.7M after 20 years, but the growth of stacked PLU significantly plateaus after approximately 4 years due to the assumptions about the Unstacked users selling and buying behaviours; they are responsible for most of the tokens going into the stacking tiers, and they run out of tokens to sell within 4 years.
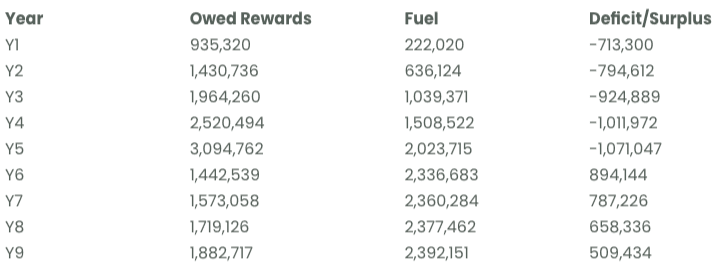
Looking at the FUEL, it is evident that at 5%, by year 6, there is sufficient FUEL to cover CRY rewards at their maximum and the Perks + Emissions (cashback) rewards, without even factoring in any forfeits (albeit they are factored in indirectly within the Machinations model).
However, since the model assumes constant growth in the Perks + Emissions rewards, eventually the amount of FUEL becomes insufficient due to the lack of minting of new tokens, and Plutus will need to start minting again after 12 years.
Revenue
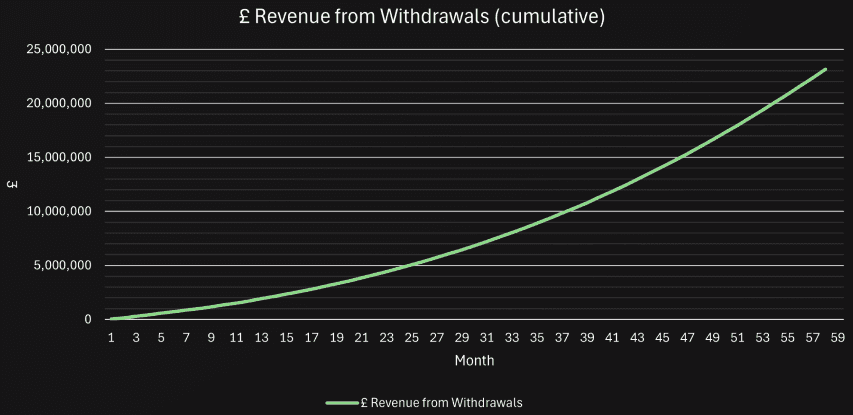
As per the model, Plutus stands to make just under £23M in total over the course of 5 years by taxing users at a £10 anchor for withdrawing PLUS directly onto exchanges.
PLUS Utilities and PlutusSwap Quantities
Users are spending PLUS on Utilities and PlutusSwap at rates defined above.
For the team to understand how much PLUS users actually end up spending, and how much $ value the team is required to create with its Utilities and PlutusSwap features so that users can spend as much PLUS as the model expects, as a function of PLUS price and quantity, we have modelled out the numbers.
Note: if the team does not create the required amount of $ value for users to exchange PLUS for, then users will likely simply hold onto their PLUS since selling it directly comes with a sizeable fiat fee. As such, the PLUS price is unlikely to be impacted, and consequently this would be a product/marketing issue rather than an economic/financial one.
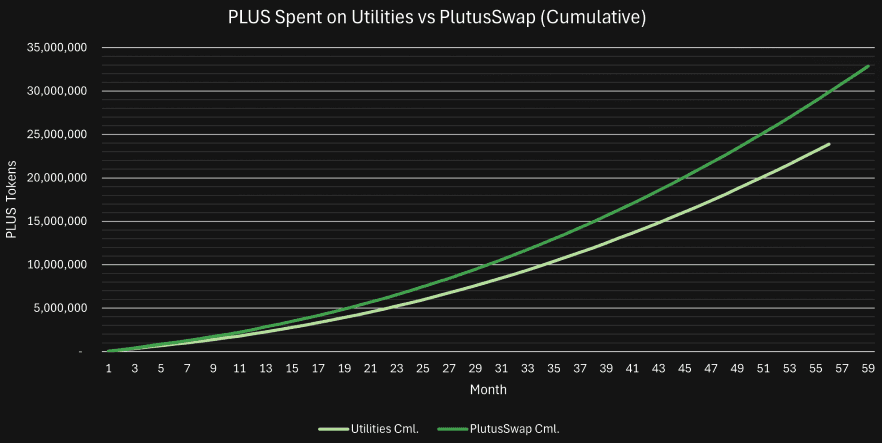
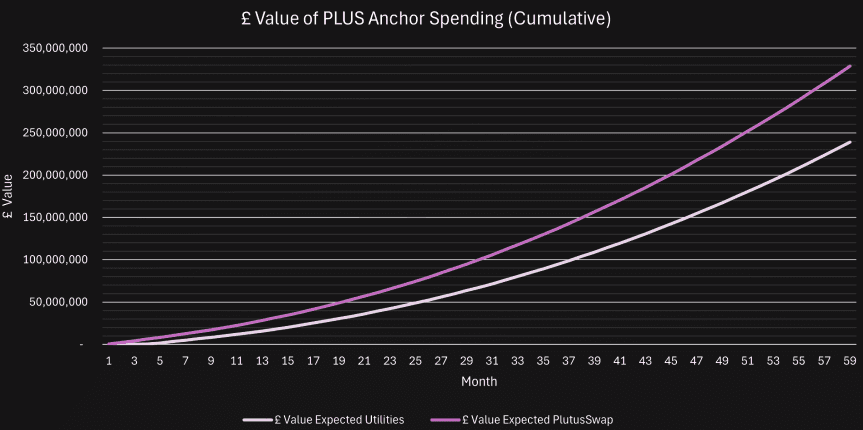
Cumulatively, a lot of tokens circulate through the utilities. In total, as per the model, Plutus would need to create around £570M worth of value over the course of 5 years. This is obviously a substantial sum, but fundamentally, if Plutus doesn’t have this much cumulative value within its utilities then users will simply redeem their PLUS on a first-come-first-served basis, and when utilities run out then users will simply hold onto their PLUS due to the expensive withdrawal fee.
Since these tokens are circulating, it makes more sense to look on the monthly scale.
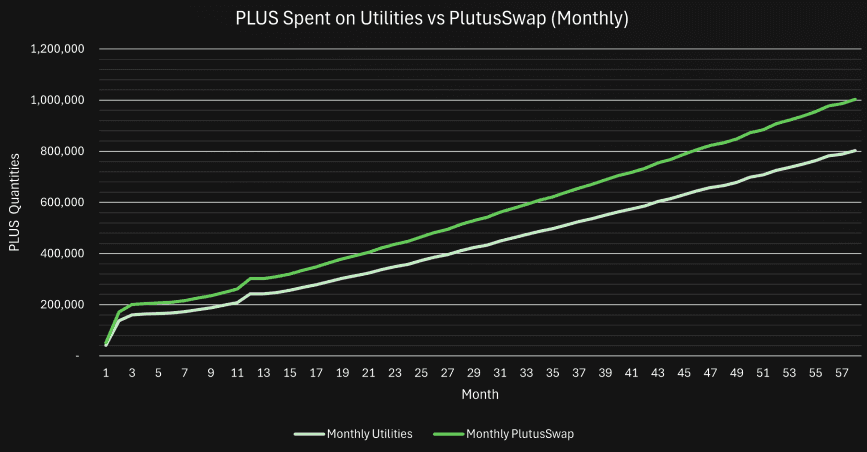
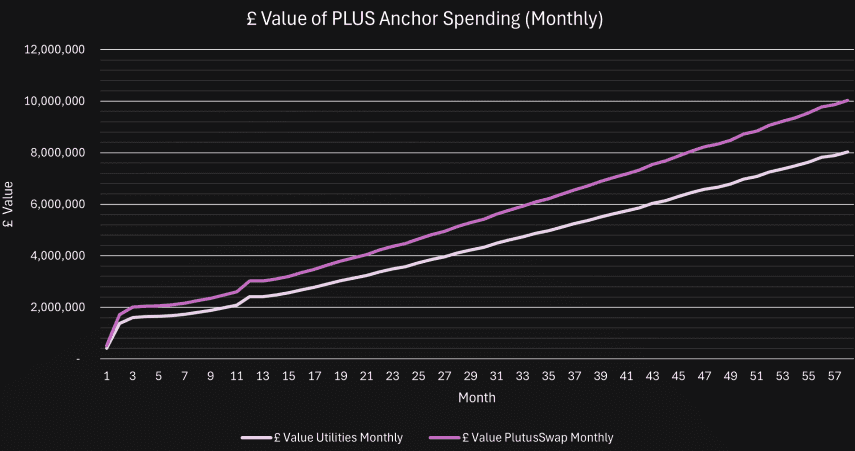
Recalling the information from the Buy Pressure section above, Plutus’ current number of users - 168,667, accounting for $1.2M in buy pressure. By year 5, or month 60, in the model, Plutus would be on $3.3M in buy pressure, which would equate to 463,834 users, ceteris paribus. This is arguably napkin maths but is done to show simply how many users the model is technically counting for.
In other words, by the end of the 5th year, the ~£18M worth of value spent per month on PLUS utilities is being done by 464k users, or around £38 per user per month.
If we look at how much $ value in PLUS is being redeemed, we get the following cumulative and monthly charts:
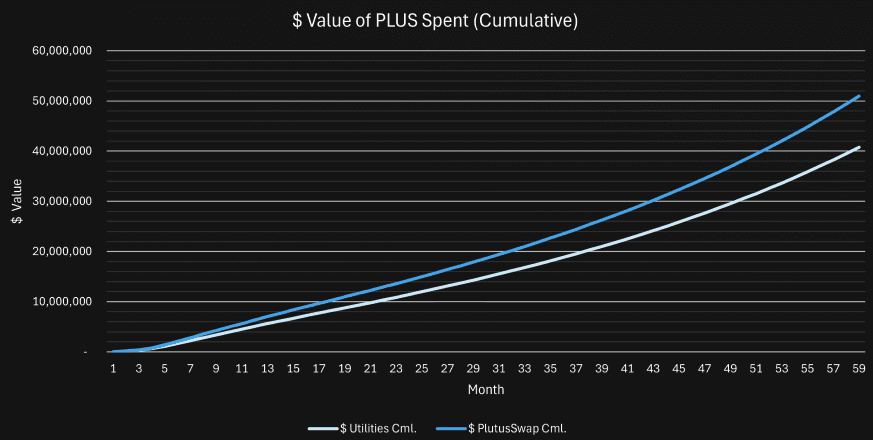
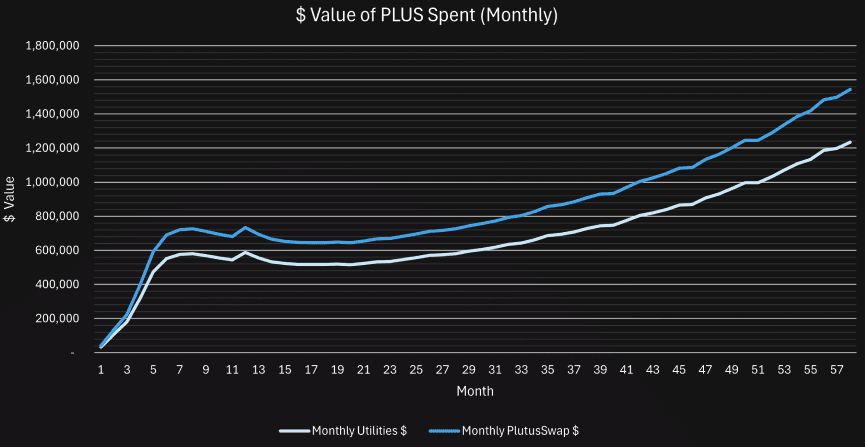
This is obviously far lower, cumulatively at ~$92M, than the £570M with the anchor. Thus, we recommend Plutus to greatly reconsider their £10 anchor to something more reasonable, like a £3-£5 anchor, or even simply scrapping the anchor altogether and just selling the utilities products for their value in PLUS value.